
In spite of some efforts, it’s still difficult to get a stable current measurement. As a reminder, on the prototype, the power is 25W with a ~18V voltage, that is around 1.5A. I conducted a tiny experiment to see in how many “steps” I can divide the current into.
I’m using an Allegro ACS for current measurement. The ACS is a hall effect device outputing a voltage proportional to the current, that can be fed to an ADC. It can measure current both ways, thus the output is centered around some middle value corresponding to 0A and can go up or down around this middle value, depending on the direction it is wired.
Unfortunately, the comparison isn’t fair, because all things aren’t equal: on one hand, this is a low side circuit (close to the ⊖ power pin), with a negative coefficient, that is the bigger the current, the lower the sample value. And this is an ACS 713. On the other hand, I have an ACS 723, high-side mounted, with a positive coefficient.
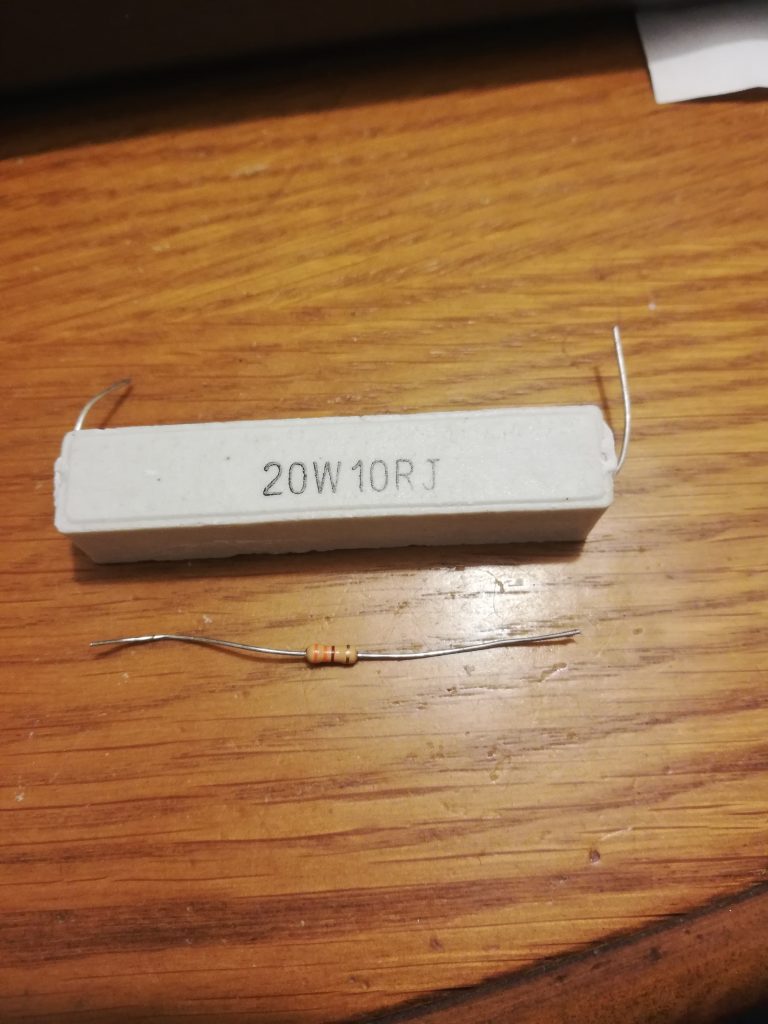
Anyway, here are the results: I’ve produced a current of 0.7A, 1.4A and 2.8A, under 18V, using resistors connected appropriately (quite beefy, since we’re talking 20W here). Each time, I take about 100 points, oversampling by averaging 256 measures. The ADC is 12 bits width, so values could be in the range 0-4095. I then plot the number of times each point has been output from the measurement, thus getting a picture of the spread of the measurement, for what is supposed to be the same current.
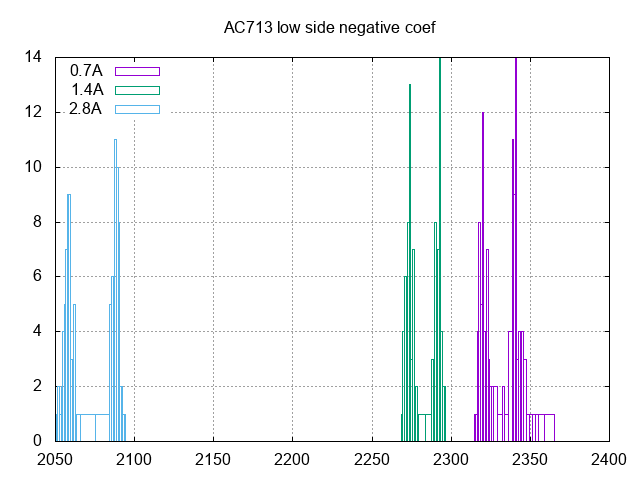
The reading is as follow: for 0.7A, the value 2320 was reported 12 times, the value 2339 11 times, 2340 9 times, and so on.
With the ACS 713 low-side, negative coef., the first thing we notice is that the data form two “spikes” for reasons unknown to me. For a given current,the ADC output is spread on about 50 values, more than the separation between 0.7A et 1.4A (about 25), thus we barely can discriminate with a 1A step, much too coarse for the 25W prototype.
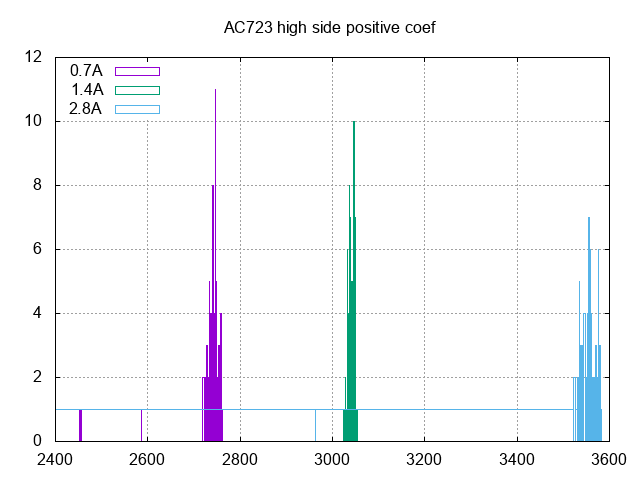
Things are much more useful with the A 723 high side positive coefficient version. The two-spikes effect is much less visible. data are gathered in a 50 range, but the separation between 0.7A and 1.4A is more than 250, thus a 0.2A precision isn’t unreasonable.